Thursday 16 July 2015

Presenting the Data! (without eating it)

     
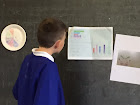
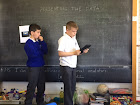
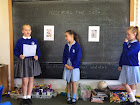
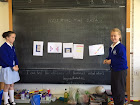
Ok, so we handed the children a plate of 24 various coloured skittles and set them the challenge of 'Presenting the Data' in any which mathematical way they liked.


Seem like a load of nonsense? Not so. The children came up with all sorts of excellent ideas including; different charts and graphs; ratio & proportion; fractions of all types; symmetrical images caught on the photo booth app plus lots, lots more besides.


Let us blow you away with our results!


IMG_3004.JPG
IMG_3005.JPG


IMG_3001.JPG


IMG_3006.JPG   IMG_3008.JPG  IMG_3009.JPG  IMG_3011.JPG


IMG_2997.JPG  IMG_3001.JPG

No comments:

Post a Comment